The search for consistent risk adjusted returns is one the of the key objectives for investors. To achieve this, they spend a lot of time and resources evaluating the right combination of diverse asset classes for inclusion in their portfolios. A popular investing approach which forms the classic building block of portfolio construction, has been the capital allocation across asset classes. A notable method for allocating capital is based on the Markowitz’s mean/variance optimization theory. For a typical investor, the decision process leads to optimal weights as well as dollar amounts distributable between various securities or asset classes. One other popular method for an investor albeit less rigorous is the 60/40 capital allocation (60% in equities and 40% in bonds). In the latter method, equities and bonds asset classes can be further broken down between Canadian, US, International for the equities portion, and duration, credit for the fixed income portion.
An implicit belief embedded in the 60/40 approach is the categorization of the 60% as the riskier portion while the 40% is considered as the less risky (or minimal risk portion). One major flaw when allocating capital across asset classes is the imbalance between the asset classes’ weights versus their risk within the portfolio; for instance, from risk perspective, the 60/40 is far from being equivalent to 60% equity risk and 40% bond risk. As illustrated in the Fig 1, over a 20 year period from 2001 to 2021, a diversified global balanced portfolio with about 60% in equities (Canadian, US, international equities, Emerging markets), 39% in bonds and 1% cash has returned 7.24% annualized with an annualized 8.58% total volatility in Canadian dollars. Zooming through the total volatility shows that the risk contribution of each asset class does not align with its dollar weight allocation. For instance, bonds account for 39% of the dollar allocation but contribute only 4% to the total risk. Canadian equities on the other hand take 22.5% of the portfolio allocation but contribute almost 40% to the portfolio total risk. Furthermore, from a risk perspective the balanced portfolio of 60% equities and 40% bonds ends up with about 96% of the equity risk! (almost equity-like risk).

Fig 1: The chart shows each individual asset’s weight relative to its contribution to the total volatility from 2001 to 2021.
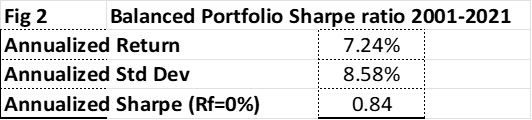
Nevertheless, the Sharpe ratio of the balance 60/40 over the last 20 years ending 2021 has been competitive and stronger than most individual asset classes. That spectacular performance over many decades emboldened the belief in the classic investment allocation by capital (Fig 2 & 3).

But as the risk decomposition of a balanced 60/40 indicate a misallocation of components’ risk versus their weights, there is an indication that the 60/40 might not provide the level of diversification expected from a portfolio to navigate in unfavourable markets regimes. In a forthcoming post I will explore other methods of allocating asset classes weight for more resilient portfolios across different market regimes.
Disclosure: I have no stock, option or similar derivative position in any of the companies mentioned, and no plans to initiate any such positions within the next 72 hours. I wrote this article myself, and it expresses my own opinions. I am not receiving compensation for it. I have no business relationship with any company whose stock is mentioned in this article.
I personally have no position in the securities indicated in this article, although my employer might hold some positions in their funds. This article is totally dissociated from my current profession and employer. The opinions are personal and for educational purposes only. Under any case this should not be considered as investment advice. Consult your financial advisor for any investment advice.

Leave a comment