As of Dec 28 2024
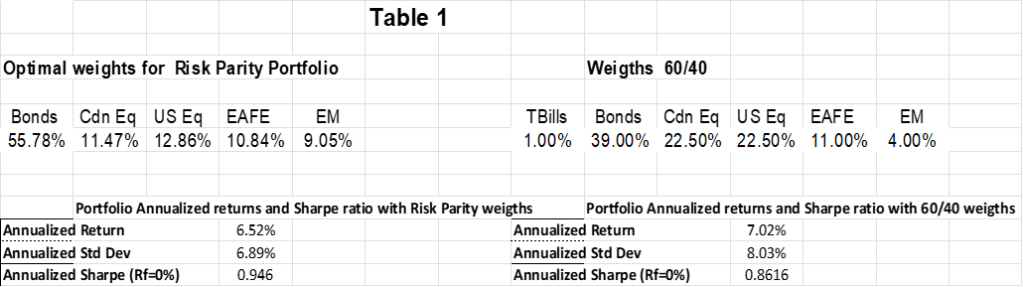
In a previous article, by decomposing the risk of a 60/40 we showed that there is some imbalance between the asset class weight and its contribution to the total risk. One other portfolio allocation method that can address that imbalance is the risk parity. Using the same data spanning a 25-year period as of November 2024, we derived a risk parity optimal weight via numerical optimization (e.g. FRAPO package in R) for each asset class. In other words, instead of focusing on capital allocation, the focus here is on risk so that each asset class contributes an equal level of risk (we exclude T-bills from the risk parity calculations as it’s quasi cash). Table1 exhibits the weights as well as annualized returns in a risk parity allocation framework versus a typical 60/40 capital allocation. There is a decent enhancement in the annualized returns generated by the RP compared to 60/40. Figure 1 illustrates how the RP contribution towards volatility remains the same for each asset class.

In practice the focus on risk would even become more effective if we include few other asset classes such as commodities, REITs and use leverage on the fixed income portion. The idea is to allocate to a range of assets that counterbalance each other in different economic regimes covering period of growth/recession, inflation/deflation, high/low interest. As each asset class behaves differently during these periods, the overall impact on the portfolio would be a more resilient and stable portfolio.

Leave a comment